Ion 2.x or 3.0
It is important to understand the traffic sent to and from a web application in order to create complete sets of rules to render it with Ion. To make it easier to diagnosis traffic, there are free tools that can capture web traffic information, one such tool is Fiddler.
Fiddler can help organizations discover what sites their internal web applications and web pages are directing users to, or receiving information from.
Simply launch Fiddler, enable logging, and then navigate to your web-based application or web site as normal using your supported IE browser version (do not enable Ion rules for this site or application yet). Note that by default, only HTTP: traffic is captured: if you need to capture HTTPS: traffic, be sure to enable that feature in Fiddler.
Once navigation is complete, you can view the list of domains that web traffic in the Fiddler window. Each of these relevant domains should be added to your set of rules for that website.
Launch Fiddler, make sure logging is enabled, and visit our demo site at http://www.aggrid.com/. This screenshot shows the first 15 requests / transfers made when navigating to this site:
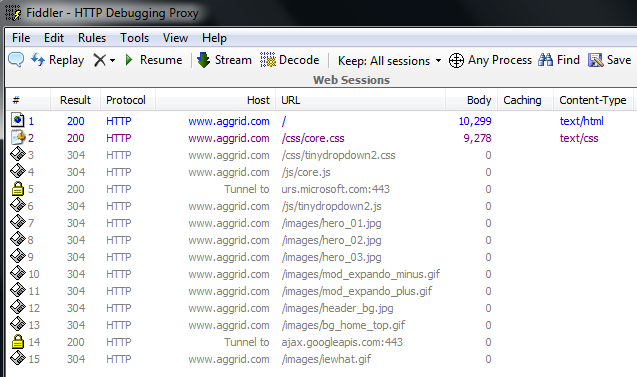
In this case, www.aggrid.com should be added to your list of rules if you want this site managed by Ion. Note that the calls to ajax.googleapis.com and urs.microsoft.com do not have to be managed by a rule as they are not relevant to the rendering of the site in question. Using this tool, you may identify additional domains or URLs that will need to be managed by your rules and profiles.
Get Fiddler at http://www.getfiddler.com.
Full help on Fiddler’s use can be found at its help & support site located at http://www.fiddler2.com/Fiddler/help/
Posted in: Ion Knowledge Base,
